Basic Augmented Reality Exercise
✎Modified 2020-11-01 by arsimone
Apply your competences in software development in a perception pipeline.
The goal of this exercise is to familiarize yourself in developing functionalities in the framemork of a pre-existing pipeline. In particular, the focus is in the perception pipeline. You will implement a computer graphics algorithm that will be a part of it.
Skills on how to develop new code as part of the Duckietown framework.
Insights into a computer graphics pipeline.
Segments Projection Exercise
✎Modified 2020-10-31 by Aleksandar Petrov
In this exercise you are asked to draw some segments on an image given a yaml file with their specification namely defining points coordinates and color of each segment.
In order to do that you will have to create a package called augmented_reality_basics with the functionalities specified below in Section 3.2 - Specification of “augmented_reality_basics”.
Then verify the results of your package in the following 3 scenarios.
Scenario 1: Calibration pattern
✎Modified 2020-10-31 by Aleksandar Petrov
- Put the robot in the middle of the calibration pattern.
- Run the node
augmented_reality_basicswith map filecalibration_pattern.yaml.
(Adjust the position of your Duckiebot until you get a decent match of reality and augmented reality.)
Scenario 2: Lane
✎Modified 2020-10-31 by Aleksandar Petrov
- Put the robot on a tile, in the middle of a straight lane segment.
- Run the node
augmented_reality_basicswith map filelane.yaml.
(Adjust the position of your Duckiebot of your Duckiebot until you get a decent match of reality and augmented reality.)
Scenario 3: Intersection
✎Modified 2020-10-31 by Aleksandar Petrov
- Put the robot at a stop line at a 4-way intersection in Duckietown.
- Run the node
augmented_reality_basicswith map fileintersection_4way.yaml.
(Adjust the position of your Duckiebot until you get a decent match of reality and augmented reality.)
Specification of “augmented_reality_basics”
✎Modified 2020-11-01 by arsimone
In this assignment you will be writing a ROS package to perform the augmented reality exercise. The program will be invoked with the following syntax:
container $ roslaunch augmented_reality_basics augmented_reality_basics.launch map_file:=map file veh:="$VEHICLE_NAME"
where map file is a YAML file containing the map as specified in Section 3.3 - Map Specification.
If you use a roslaunch in the launch.sh file remember to put ‘dt-exec before each command.
The package structure must be the one provided by the Duckietown template-ros. In addition, create a map directory where you can store the map files.
Your program is supposed to do the following:
- Load the intrinsic / extrinsic calibration parameters for the given robot.
- Read the map file corresponding to the
map_fileparameter given in the roslaunch command above. - Subscribe to the image topic
/robot name/camera_node/image/compressed. - When you receive an image, project the map features onto it, and then publish the result to the topic
/robot name/node_name/map file basename/image/compressedwheremap file basenameis the basename of the file without theyamlextension.
Create a ROS node called augmented_reality_basics_node, which imports an Augmenter class, from an augmented_reality_basics module.
The Augmenter class should contain the following methods:
- A method called
process_imagethat undistorts raw images. - A method called
ground2pixelthat transforms points in ground coordinates (i.e. the robot reference frame) to pixels in the image. - A method called
render_segmentsthat plots the segments from the map files onto the image.
In the ROS node, you just need a callback on the camera image stream that uses the Augmenter class to modify the input image. Therefore, implement a method called callback that writes the augmented image to the appropriate topic.
As you will subscribe to the camera node’s camera_node/image/compressed topic, you will need to run the dt-duckiebot-interface container alongside your own container.
Map Specification
✎Modified 2020-10-31 by Aleksandar Petrov
The map file contains a 3D polygon, defined as a list of points and a list of segments that join those points.
The format is similar to any data structure for 3D computer graphics. Additionally, we have these two specifics:
- Points are referred to by name.
- It is possible to specify a reference frame for each point. (This will help make this into a general tool for debugging various types of problems).
Here is an example of the file contents, which is hopefully self-explanatory. The following map file describes three points, and two lines.
points:
    # define three named points: center, left, right
    center: [axle, [0, 0, 0]] # [reference frame, coordinates]
    left: [axle, [0.5, 0.1, 0]]
    right: [axle, [0.5, -0.1, 0]]
segments:
- points: [center, left]
  color: [rgb, [1, 0, 0]]
- points: [center, right]
  color: [rgb, [1, 0, 0]]
Reference frame specification
✎Modified 2020-11-01 by arsimone
The reference frames are defined as follows:
axle: center of the wheels axle; coordinates are in 3D.camera: camera frame; coordinates are in 3D.image01: a reference frame in which(0,0)is top left, and(1,1)is bottom right of the image; coordinates are 2D.
(Other reference frames will be introduced later, such as the world and tile frames, which will also need the pose of the robot.)
Color specification
✎Modified 2020-10-31 by Aleksandar Petrov
RGB colors are written as:
[rgb, [R, G, B]]
where the RGB values are between 0 and 1. Alternatively, you can use one of the following strings defining some popular colours:
red, equivalent to[rgb, [1,0,0]];green, equivalent to[rgb, [0,1,0]];blue, equivalent to[rgb, [0,0,1]];yellow, equivalent to[rgb, [1,1,0]];magenta, equivalent to[rgb, [1,0,1]];cyan, equivalent to[rgb, [0,1,1]];white, equivalent to[rgb, [1,1,1];black, equivalent to[rgb, [0,0,0]].
Map specification files
✎Modified 2020-10-31 by Aleksandar Petrov
hud.yaml
✎
Modified 2019-10-14 by gibernas
This pattern serves as a simple test that we can draw lines in image coordinates:
points:
    TL: [image01, [0, 0]]
    TR: [image01, [0, 1]]
    BR: [image01, [1, 1]]
    BL: [image01, [1, 0]]
segments:
- points: [TL, TR]
  color: red
- points: [TR, BR]
  color: green
- points: [BR, BL]
  color: blue
- points: [BL, TL]
  color: yellow
The expected result is to put a border around the image: red on the top, green on the right, blue on the bottom, yellow on the left.
calibration_pattern.yaml
✎
Modified 2019-10-28 by Rohit Suri
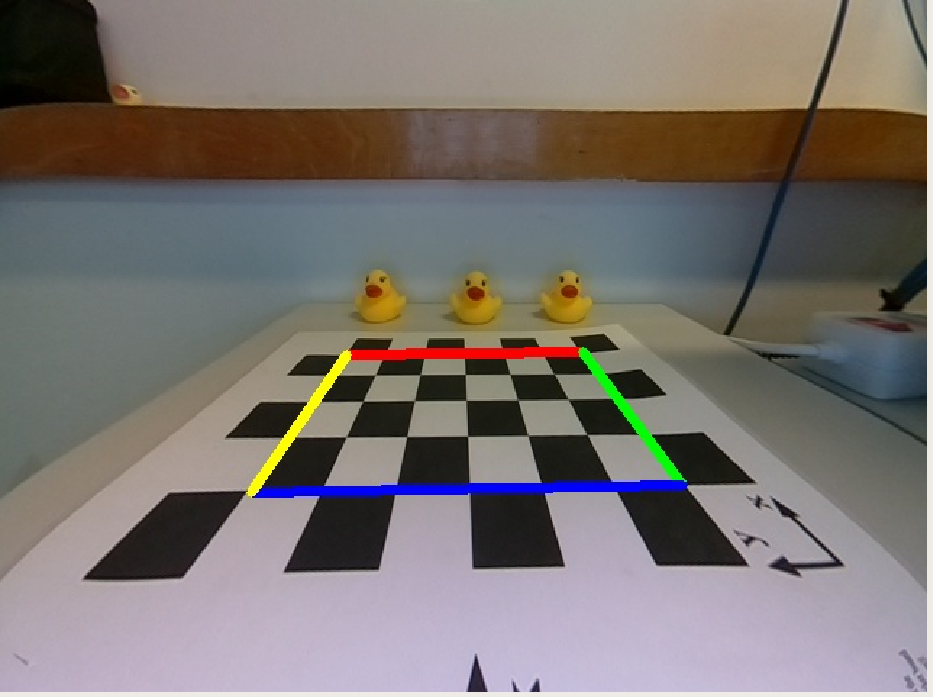
This pattern is based off the checkerboard calibration target used in estimating the intrinsic and extrinsic camera parameters:
points:
    TL: [axle, [0.315, 0.093, 0]]
    TR: [axle, [0.315, -0.093, 0]]
    BR: [axle, [0.191, -0.093, 0]]
    BL: [axle, [0.191, 0.093, 0]]
segments:
- points: [TL, TR]
  color: red
- points: [TR, BR]
  color: green
- points: [BR, BL]
  color: blue
- points: [BL, TL]
  color: yellow
The expected result is to put a border around the inside corners of the checkerboard: red on the top, green on the right, blue on the bottom, yellow on the left, like below.
lane.yaml
✎
Modified 2020-10-31 by Aleksandar Petrov
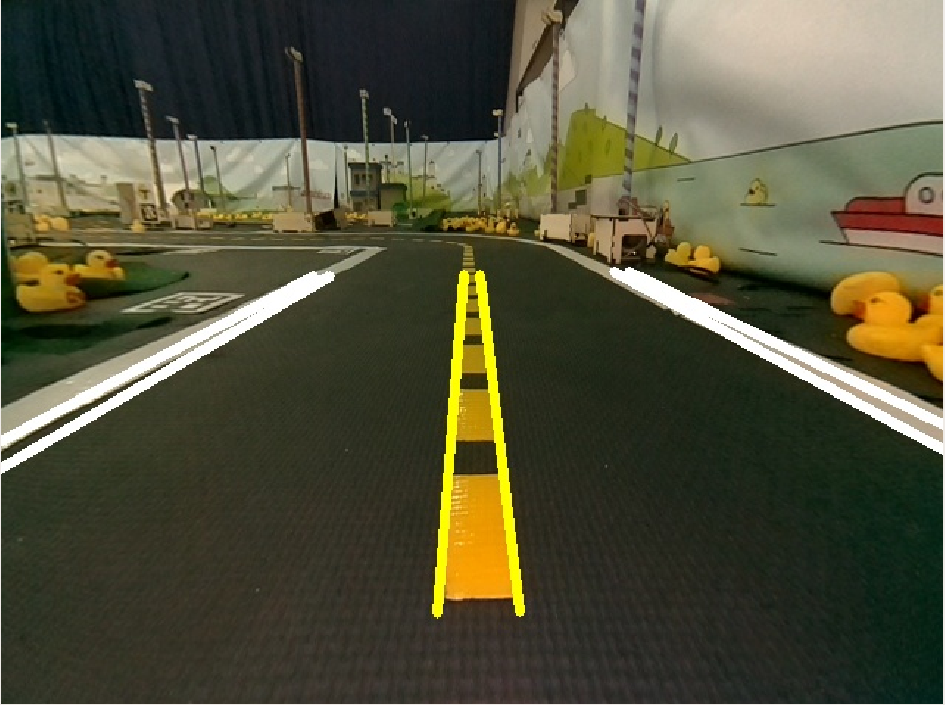
We want something like this:
 |   |          | . |             |   |
 |   |          | . |             |   |
 |   |          | . |             |   |
 |   |          | . |             |   |
 |   |          | . |             |   |
 |   |          | . |             |   |
 W   W          Y   Y             W   W
 1   2          3   4             5   6
Then we have:
points:
     p1: [axle, [0.15, 0.2794, 0]]
     q1: [axle, [0.6096, 0.2794, 0]]
     p2: [axle, [0.15, 0.2286, 0]]
     q2: [axle, [0.6096, 0.2286, 0]]
     p3: [axle, [0.15, 0.0127, 0]]
     q3: [axle, [0.6096, 0.0127, 0]]
     p4: [axle, [0.15, -0.0127, 0]]
     q4: [axle, [0.6096, -0.0127, 0]]
     p5: [axle, [0.15, -0.2286, 0]]
     q5: [axle, [0.6096, -0.2286, 0]]
     p6: [axle, [0.15, -0.2794, 0]]
     q6: [axle, [0.6096, -0.2794, 0]]
segments:
 - points: [p1, q1]
   color: white
 - points: [p2, q2]
   color: white
 - points: [p3, q3]
   color: yellow
 - points: [p4, q4]
   color: yellow
 - points: [p5, q5]
   color: white
 - points: [p6, q6]
   color: white
Expected output:
intersection_4way.yaml
✎
Modified 2019-10-14 by gibernas
points:
    NL1: [axle, [0.247, 0.295, 0]]
    NL2: [axle, [0.347, 0.301, 0]]
    NL3: [axle, [0.218, 0.256, 0]]
    NL4: [axle, [0.363, 0.251, 0]]
    NL5: [axle, [0.400, 0.287, 0]]
    NL6: [axle, [0.409, 0.513,   0]]
    NL7: [axle, [0.360, 0.314, 0]]
    NL8: [axle, [0.366, 0.456, 0]]
    NC1: [axle, [0.372, 0.007, 0]]
    NC2: [axle, [0.145, 0.008, 0]]
    NC3: [axle, [0.374, -0.0216, 0]]
    NC4: [axle, [0.146, -0.0180, 0]]
    NR1: [axle, [0.209, -0.234, 0]]
    NR2: [axle, [0.349, -0.237, 0]]
    NR3: [axle, [0.242, -0.276, 0]]
    NR4: [axle, [0.319, -0.274, 0]]
    NR5: [axle, [0.402, -0.283, 0]]
    NR6: [axle, [0.401, -0.479, 0]]
    NR7: [axle, [0.352,  -0.415, 0]]
    NR8: [axle, [0.352, -0.303, 0]]
    CL1: [axle, [0.586, 0.261, 0]]
    CL2: [axle, [0.595, 0.632, 0]]
    CL3: [axle, [0.618, 0.251, 0]]
    CL4: [axle, [0.637, 0.662, 0]]
    CR1: [axle, [0.565, -0.253, 0]]
    CR2: [axle, [0.567, -0.607, 0]]
    CR3: [axle, [0.610, -0.262, 0]]
    CR4: [axle, [0.611, -0.641, 0]]
    FL1: [axle, [0.781, 0.718, 0]]
    FL2: [axle, [0.763, 0.253, 0]]
    FL3: [axle, [0.863, 0.192, 0]]
    FL4: [axle, [1.185, 0.172, 0]]
    FL5: [axle, [0.842, 0.718, 0]]
    FL6: [axle, [0.875, 0.271,   0]]
    FL7: [axle, [0.879, 0.234, 0]]
    FL8: [axle, [1.180, 0.209, 0]]
    FC1: [axle, [0.823, 0.0162, 0]]
    FC2: [axle, [1.172, 0.00117, 0]]
    FC3: [axle, [0.845, -0.0100, 0]]
    FC4: [axle, [1.215, -0.0181, 0]]
    FR1: [axle, [0.764, -0.695, 0]]
    FR2: [axle, [0.768, -0.263, 0]]
    FR3: [axle, [0.810, -0.202, 0]]
    FR4: [axle, [1.203, -0.196, 0]]
    FR5: [axle, [0.795, -0.702, 0]]
    FR6: [axle, [0.803, -0.291, 0]]
    FR7: [axle, [0.832, -0.240, 0]]
    FR8: [axle, [1.210, -0.245, 0]]
segments:
- points: [NL1, NL2]
  color: white
- points: [NL3, NL4]
  color: white
- points: [NL5, NL6]
  color: white
- points: [NL7, NL8]
  color: white
- points: [NC1, NC2]
  color: yellow
- points: [NC3, NC4]
  color: yellow
- points: [NR1, NR2]
  color: white
- points: [NR3, NR4]
  color: white
- points: [NR5, NR6]
  color: white
- points: [NR7, NR8]
  color: white
- points: [CL1, CL2]
  color: yellow
- points: [CL3, CL4]
  color: yellow
- points: [CR1, CR2]
  color: yellow
- points: [CR3, CR4]
  color: yellow
- points: [FL1, FL2]
  color: white
- points: [FL3, FL4]
  color: white
- points: [FL5, FL6]
  color: white
- points: [FL7, FL8]
  color: white
- points: [FC1, FC2]
  color: yellow
- points: [FC3, FC4]
  color: yellow
- points: [FR1, FR2]
  color: white
- points: [FR3, FR4]
  color: white
- points: [FR5, FR6]
  color: white
- points: [FR7, FR8]
  color: white
Suggestions
✎Modified 2020-11-01 by arsimone
Start by using the file hud.yaml. To visualize it, you do not need the
calibration data. It will be helpful to make sure that you can do the easy
parts of the exercise: loading the map, and drawing the lines.
To write the segments you can use this function:
def draw_segment(self, image, pt_x, pt_y, color):
    defined_colors = {
        'red': ['rgb', [1, 0, 0]],
        'green': ['rgb', [0, 1, 0]],
        'blue': ['rgb', [0, 0, 1]],
        'yellow': ['rgb', [1, 1, 0]],
        'magenta': ['rgb', [1, 0 , 1]],
        'cyan': ['rgb', [0, 1, 1]],
        'white': ['rgb', [1, 1, 1]],
        'black': ['rgb', [0, 0, 0]]}
    _color_type, [r, g, b] = defined_colors[color]
    cv2.line(image, (pt_x[0], pt_y[0]), (pt_x[1], pt_y[1]), (b * 255, g * 255, r * 255), 5)
    return image
To read a generic YAML file you can use this function:
def readYamlFile(self,fname):
    """
    Reads the YAML file in the path specified by 'fname'.
    E.G. :
        the calibration file is located in : `/data/config/calibrations/filename/DUCKIEBOT_NAME.yaml`
    """
    with open(fname, 'r') as in_file:
        try:
            yaml_dict = yaml.load(in_file)
            return yaml_dict
        except yaml.YAMLError as exc:
            self.log("YAML syntax error. File: %s fname. Exc: %s"
                     %(fname, exc), type='fatal')
            rospy.signal_shutdown()
            return
For other functionalities (i.e. loading the calibration files), we recommend that you invest some time in looking into the existing Duckietown code. You can find some helpful functions and methods there.