AMOD18 Planning Under Uncertainty
✎Modified 2019-04-28 by tanij
Planning under uncertainty (observation uncertainty) is a simulation-based project for the AMOD-Duckietown Fall 2018 course at ETH Zurich. This document presents both docker and ros based instructions to run the demo. A more in-depth description of the project is available towards the end of this document.
Planning under Uncertainty Demo
✎Modified 2018-12-27 by aroumie1997
Laptop with Docker installation
Desktop-Full installation of ros-kinetic
duckietown-world (and all its requirements - for ROS-only Demo)
Planning with uncertainty simulation demo (visualization in rviz) implementing the collision-free path planning and velocity profiling algorithms
Video of expected results
✎Modified 2018-12-27 by aroumie1997

The video is at https://vimeo.com/307404964.
Source code is avalaible here.
Duckietown setup notes
✎Modified 2018-12-27 by aroumie1997
Currently, plannning under uncertainty is tested only in simulation environments using rviz for visualization. In fact, the simulation works for any map type that is available. In the future, the package will be available as a ros package for testing on the duckiebots in a duckietown setup.
Add a new .yaml file in duckietown-world repo if a new map type is needed
Pre-flight checklist
✎Modified 2018-12-27 by aroumie1997
Those following prerequisites ensure that the simulation will run properly:
Check: Desktop-Full installation of ros-kinetic
Check: duckietown-world (and all its requirements)
Check: Ubuntu16.04 with python2.7
Check: Docker installation for docker instructions
Demo instructions
✎Modified 2019-04-28 by tanij
Docker instructions
First, pull the docker image:
laptop $ docker pull aroumie1997/uplan:v1
Next, run:
laptop $ docker run -it \
   --env="DISPLAY" \
   --env="QT_X11_NO_MITSHM=1" \
   --volume="/tmp/.X11-unix:/tmp/.X11-unix:rw" \
   aroumie1997/uplan:v1
In order to see the rviz simulation, the host OS should have a desktop-full installation of ros with rviz. You may need to run the following line before running the container:
laptop $ xhost +local:root
After running the container, do not forget to run the following, as this compromises access control to X server on your host:
laptop $ xhost -local:root
ROS-only instructions
Step 0: Make sure you sourced ros
laptop $ source /opt/ros/kinetic/setup.bash (Use setup.zsh If you are using zsh shell)
Step 1: Create a catkin workspace in your home directory
laptop $ mkdir -p ~/catkin_ws/src
laptop $ cd ~/catkin_ws/src
Step 2: Clone the following repo duckietown-uplan
laptop $ git clone https://github.com/duckietown/duckietown-uplan
Step 3: Installation of dependencies (NOTE: make sure that pip installation belongs to python 2.7)
laptop $ cd duckietown-uplan/lib-uplan
laptop $ pip install -r requirements.txt --user       (Might require or --user)
laptop $ sudo python setup.py develop --no-deps
Step 4: Go back to catkin_ws main directory and run catkin_make
laptop $ cd ..
laptop $ catkin_make
Ensure all three packages build correctly and custom messages are built
laptop $ source devel/setup.bash               (Or zsh)
laptop $ roslaunch uplan_visualization planningUncertainty.launch
YOU MUST BE ABLE TO IMPORT duckietown_world SUCCESSFULLY to launch this demo in ros .
Experimentation
✎Modified 2019-04-28 by tanij
For even further experimentation, ou can edit the following parameters and observe how the planned path and the velocities along the path change accordingly:
- min. velocity, max. velocity, discretization of the velocity space
- graph augmentation parameters like number of extra lanes to the right, number of extra lanes to the left and number of control point to spawn between two original control points.
- duckiebot width and height
- field-of-view of each duckiebot
- initial obstacle probability to consider (0 to 1)
- duckietown map
Augmenting the graph basically means how many paths the duckiebot will consider when planning under uncertainity. (The more you augment the graph, the slower the demo will be since there will be more control points to consider while planning)
Features
✎Modified 2018-12-27 by aroumie1997
- Visualization of maps from duckietown-world
- Planning under uncertainty to get a shortest collision free path under current observations.
- Planning under uncertainty to get a velocity profiler for the shortest path chosen.
- Real-time visualization of duckiebots
- Visualization of 10 future steps of duckiebot trajectory
- Visualizing uncertainty probability field
- Visualizing velocity profiler
- Visualizing of the shortest path planned
Troubleshooting
✎Modified 2019-04-28 by tanij
Having followed the docker instructions to run the demo, everything must run smoothly.
laptop $ No protocol specified
rqt: cannot connect to X server unix:0
The above message appears when running the docker container
Run the following
laptop $ xhost +local:root
After running the container, do not forget to run the following, as this compromises access control to X server on your host:
laptop $ xhost -local:root
For the ROS- only instructions, common symptoms include:
problems with duckietown_world
Install using pip with --user
laptop $ pip install --user duckietown_world
Map doesn’t show actual texture of tiles
make sure you installed git-lfs
laptop $ curl -s https://packagecloud.io/install/repositories/github/git-lfs/script.deb.sh | sudo bash
laptop $ sudo apt-get install  -y python-pip git git-lfs
Demo failure
✎Modified 2018-12-27 by aroumie1997
For failure in demo execution, refer to the troubleshooting section above.
Within the demo itself, there might be instances where the duckiebot cannot perform any maneuvers to avoid other duckiebots (dynamic obstacles in general). This is normal and cannot be avoided as it involves motions that are too fast for a duckiebot to handle (faster than the planning algorithm update).
More on Planning Under Uncertainty
✎Modified 2018-12-17 by aroumie1997
Motivation
✎Modified 2018-12-27 by aroumie1997
What would a self-driving car do if the car just in front it has malfunctioning break lights? What would it do if a kid suddenly lets go of his mother’s grasp and jumps into the road? What would it do if the sensors it uses for perception break down unexpectedly? All of these situations and more may be captured if the planning algorithms are planning for such uncertainties, which include the behavior of other agents in the environment as well as our perception of the environment itself.
Theory
✎Modified 2019-04-28 by tanij
Building of the augmentified pose graph network
The augmentified pose graph network is built from the original lane control points. It is the same graph as the one provided from the duckietown_world package but with more poses/ control points as well as other lanes; this allows the duckiebot to move more freely in the map to avoid obstacles and plan under uncertainty. The graph contains important information ( transforms, in-lane, distance-to-center, …) that is used extensively in each of the submodules described next.
Collision-free shortest path planning
The collision matrix is built from the intersection of the possible footprints of the duckiebots in the map.
The collision matrix is the same for a particular map and augmentified pose graph network; hence, it is calculated once at the beginning, and then saved to be used throughout the algorithm. Given an occupancy vector for all the nodes in the graph, one can figure out which set of nodes are forbidden by simply taking the product of the matrix and the occupancy vector:
The path planner takes into account both the shortest distance and blocked nodes, so that the end result is the shortest collision-free path. This path is sent as an output to the velocity profiling algorithm, described next.
Applying A* to the discretized velocity space
To plan a velocity trajectory using the path retrieved from the simulation we need to have a list of uncertainties of an obstacle being in the path and the list of the SE2Transforms objects: * 1 means that we are certain that an obstacle is in a certain point in the path * 0 means that we are completely certain that there is no obstacle
We apply A* algorithm to get the velocity profile for a given path. The cost function used here is:
For the planning algorithm to know how to plan for a good velocity profile we use a cost functions that includes the following terms:
- : changes in velocity from node to node
- : The difference in uncertainty from node to node
- : the uncertainty level
- : the normalized velocity
- : error between reference and actual speed (normalized) (reference is taken as , this makes us go as fast as possible given that there is no uncertainty)
The current implemented cost function is:
Of course, the cost function is customizable and can be change with a few lines of code; if no cost function is sent to the velocity profiler , it is going to use the above mentioned cost function.
Experimenting with different cost functions:


Logic and Software Architecture
✎Modified 2019-04-28 by tanij
We propose a planning algorithm that outputs a trajectory and corresponding velocity profile, in a discretized space, resembling a railway/subway planning to perform multi-objective optimization for the shortest path under uncertainty.
We predefine “legal” routes a duckiebot can take, including the ones at intersections. Each route is composed of several nodes and edges connecting them which are then further subdivided into a predefined number of line-segments. These predefined routes allow the duckiebot to go in a violating lane for example to pass another duckiebot or pass one.
Our proposed planner assigns a cost for each of the control points (nodes) taking into consideration the various degrees of uncertainty, and plan a path to goal state. A simple A* algorithm will be then used to define a velocity profile for the path calculated by the planner.
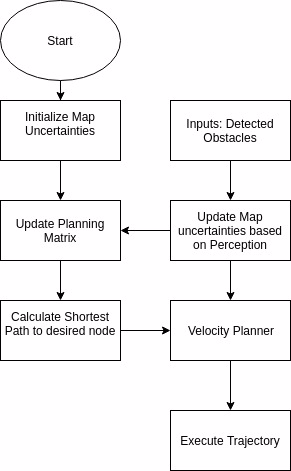
Initialization:
All nodes are assigned a fixed value associated with the probability of an obstacle being present at that node. The collision matrix defines the pairs of poses where the footprint of one duckiebot in one pose intersects that of another duckiebot in the other pose of that pair. The occupancy vector defines the set/vector of poses (graph nodes) that are occupied (through the footprint of the duckiebot). This vector is updated to include the footprint of duckiebots in the planning duckiebot’s field of view.
Planning:
Given a start and end goal, the planner outputs a shortest path using Dijkstra’s algorithm.
At each timestep the duckiebot updates its probability according to the obstacles it observes in its field view. Nodes with obstacles are assigned an uncertainty of 1 and a cost of infinity. Obstacle free nodes are assigned a zero cost and zero uncertainty probability.
Once the probabilities and collision matrices are updated in the observation model, the planning algorithm replans a path to the goal. The VelocityProfiler takes in this path and outputs a velocity profile for the given trajectory. This process persists until the goal is reached.
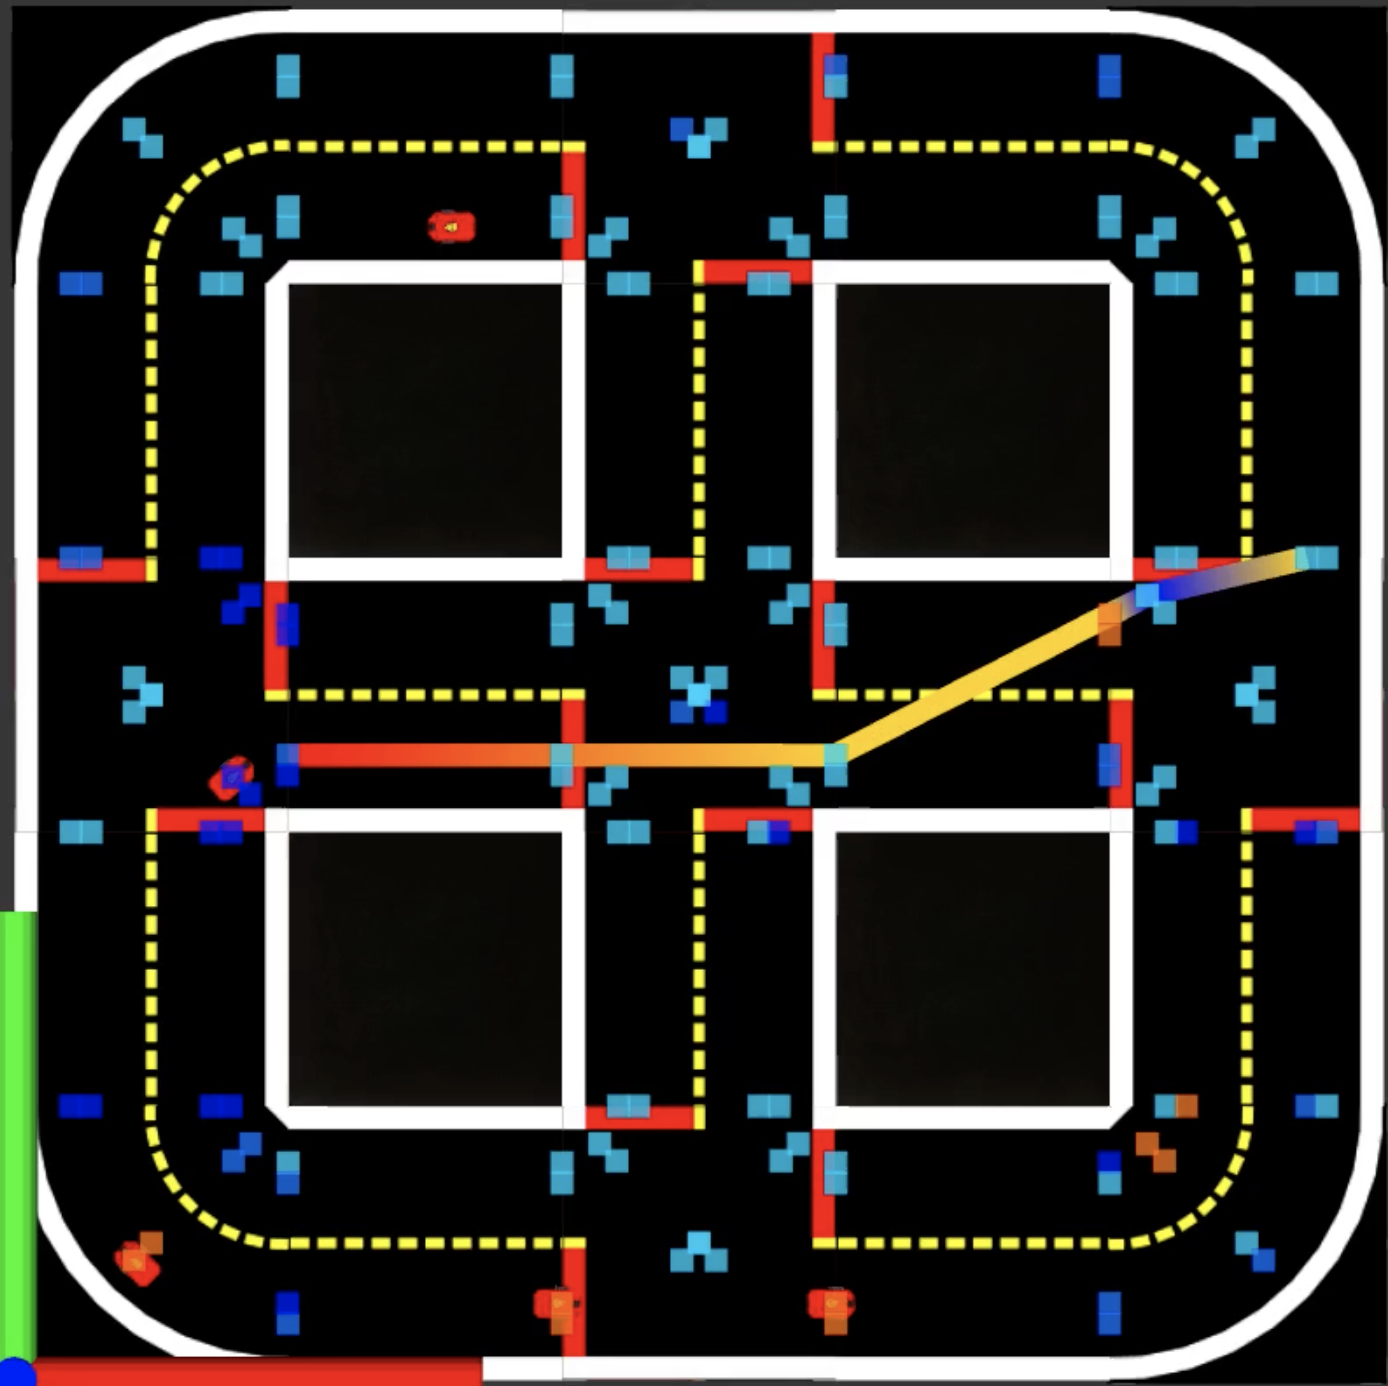
Visualization:
The trajectory output and the uncertainties calculated for the duckiebot are then published using markers and subscribe to rviz.
The trajectory path is colorized according to the velocity profile; high to low velocities are mapped from red to blue shades.
The uncertainties at each node are also colorized according to their magnitudes. Red shades represents higher probabilities of an obstacle being present and bluer shades represent unoccupied nodes.
Source code is avalaible here. The lib-uplan package contains the algo (algorithm) as well as other python-based folders for simulation.
More on Rviz visualizer
The ros-uplan package contains all the necessary nodes needed for a proper simulation and a visualization of this simulation. The ROS workspace has the following packages:
-
uplan_visualization
-
uncertainty_planning
-
duckietown_visualization (see documentation for more details)
How it works
To understand the working of this package, you need a basic understanding of the
ROS Transform library and
RViz Markers. This package reads
the map having name map_name from duckietown-world and broadcasts markers
(MESH_RESOURCE)
for each element of the map. Each class of elements (tiles, road signs, etc.) is
published in a different namespace under the transform /map to provide the
feature of turning off a certain category of map elements.
The package uses two custom messages: duckieData.msg and DuckieStruct.msg
More information found here: ROS Custom Messages.
Package Description
The uplan_visualization package has the main node which calls the planning functions and publishes the results for simulation in RViz. This package is just for visualizing the outcome of the planning under uncertainty algorithm.
In /src:
-
publish_duckieData.py: Given the type of map to use and number of duckiebots to be spawned, this node calls the planning under uncertainty functions from theuncertainty_planningpackage. Once the trajectory, velocity profile for corresponding trajectory and the uncertainty values for duckiebot are received, the node publishes them onduckieData_publisherandduckieUncertainty_publishertopics, using the custom messages -duckieData.msgandduckieStruct.msg. This node also publishes the current position of each duckiebot using a tf-broadcaster, this position is wrt toduckiebot_linkframe, which can be specified in the launch file (currently it is set as the global frame). -
publish_trajec.py: This node subscribes to theduckieData_publishertopic publishes the trajectory poses and corresponding velocities as coloredRVizLineStrip markers on the topictrajectory_markers. -
publish_uncertainty.py: This node subscribes to theduckieUncertainty_publishertopic publishes the trajectory poses and corresponding velocities as coloredRVizPoints markers on the topicuncertainty_markers.
In /config:
-
example.yaml: Contains a list of duckiebots to be spawned. This list is used to label each bot’s frame inRViz. -
myconfig.rviz:Rvizconfig file for visualizing trajectory and uncertainty markers
In /launch:
planningUncertainty.launch: This is the main launch file used to execute planning and visualization. It launches all python scripts/ROS nodes in /src and visualization nodes in /duckietown_visualization. It allows to specify duckietown_link frame and the map type to be used.
In /msg:
There are two custom messages: duckieData.msg and duckieStruct.msg
The duckieData.msg has three fields: A String label for the duckie, a list of Pose2D, SE2points, and a list of floats value.
The duckieStruct.msg is a list of duckieData.msg.
Trajectory: For this message, the SE2points has the path and the value field has the corresponding velocities.
Uncertainty: For this message, the SE2points has the positions for all control points on the map and the value field has the corresponding uncertainties.
The uncertainty_planning package contains the backend logic for path planning while keeping track of obstacles and updating uncertainties.
Once a collision free path is available, the uncertainties are calculated and the velocity profiler outcome is available, these values are utilized by the ROS visualizer to render the trajectories and uncertainties in RViz.
Using uplan-visualization with your pipeline
Go through the publish_duckieData.py in the package ros-uplan folder to understand
how to use uplan-visualization. Here you will populate the duckie trajectory/velocity and uncertainty values and publish them as markers to RViz, using uncertainty_planning package.
- First, create a list of duckiebot names which you want to visualize in a yaml
file similar to
uplan-visualization/config/example.yaml - For each duckiebot, publish a transform from frame
duckiebot_linkto that duckiebot.duckiebot_linkis a fixed frame which is the origin of your measurements for each duckiebot. - In the
publish_trajec.pyandpublish_uncertainty.pynodes, populate the duckieStruct meesages and publish on corresponding topics. - The trajectory is plotted using the line marker_array and uncertainty using Cubelist
marker_array.
Results
✎Modified 2019-04-28 by tanij
- Goal 1: Obstacle avoidance (dynamic and static), i.e. collision-free shortest path
We can clearly see that duckiebots running the path planning algorithm successfully manage to avoid other duckiebots (be it stationary or dynamic).
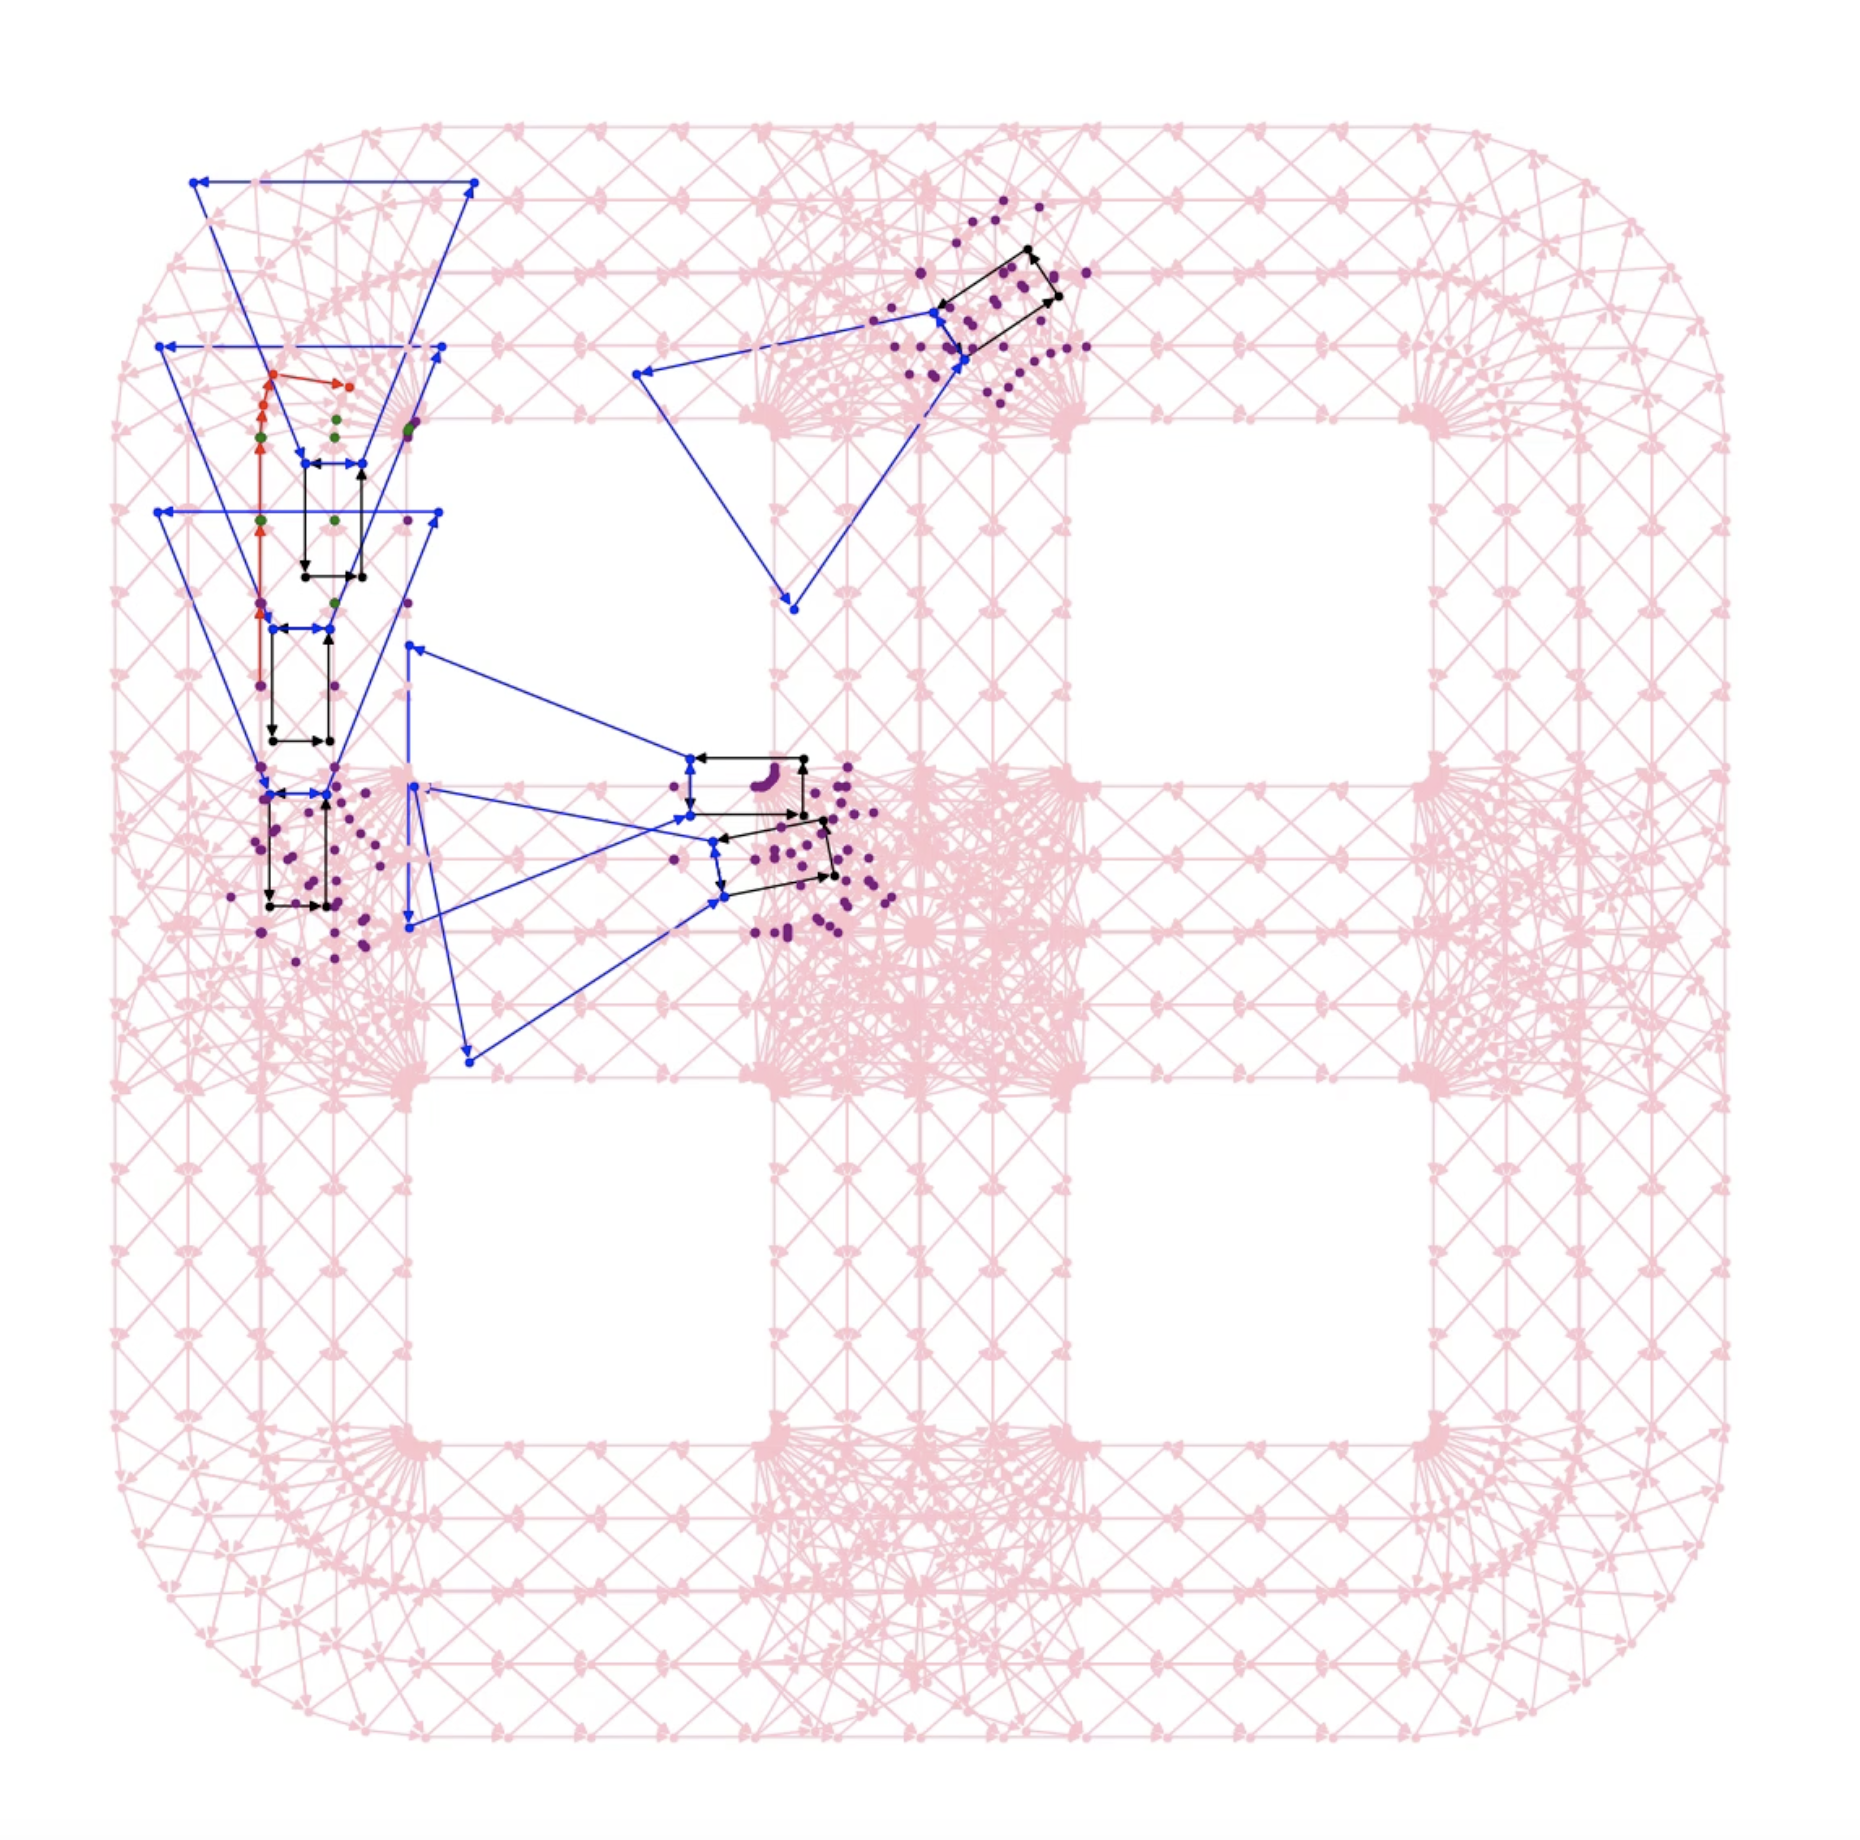
- Goal 2: Velocity profiler
The velocity profiling algorithm adds an additional measure of safety in that it limits the velocity of the duckiebot in regions where it is not so certain about its environment. Below are examples of both the skeleton graph visualization and the rviz visualization of the planning and velocity profiling algorithms.
Future Work
✎Modified 2018-12-27 by aroumie1997
We mention a few areas where the code/architecture of the simulator can be further optimized:
- More efficiency: it is computationally expensive to augment the graph (to be optimized in C++ library - 100x faster)
- Observation model enhancement
- Environment enhancement (other types of obstacles, conditions,…)
- Testing on the duckiebots
References
✎Modified 2018-12-27 by aroumie1997